3.4.2Management Board Remuneration in 2017
The actual remuneration for 20171 (see below) is set out hereafter in four sections, namely 1. Base Salary, 2. Short-Term Incentive, 3. Long-Term Incentive and 4. Pension. After these four sections more insight is provided into the pay ratio of the Management Board members against the rest of the organization as well as some other important service and remuneration elements.
Remuneration of the Management Board by (former) member
|
Bruno Chabas |
Douglas Wood |
Philippe Barril |
Erik Lagendijk |
Peter van Rossum* |
Total |
|||||||
|---|---|---|---|---|---|---|---|---|---|---|---|---|
|
in thousands of EUR |
2017 |
2016 |
2017 |
2016 |
2017 |
2016 |
2017 |
2016 |
2017 |
2016 |
2017 |
2016 |
|
Base salary |
747 |
773 |
440 |
110 |
514 |
532 |
382 |
396 |
158 |
537 |
2,241 |
2,349 |
|
STI |
1,489 |
708 |
642 |
72 |
803 |
379 |
597 |
282 |
224 |
379 |
3,755 |
1,820 |
|
LTI |
1,665 |
1,247 |
709 |
93 |
1,004 |
618 |
833 |
447 |
317 |
705 |
4,528 |
3,109 |
|
Pensions |
245 |
245 |
110 |
28 |
138 |
138 |
102 |
102 |
66 |
151 |
661 |
664 |
|
Other |
284 |
159 |
41 |
8 |
147 |
143 |
37 |
32 |
11 |
264 |
521 |
605 |
|
Total Remuneration |
4,431 |
3,132 |
1,942 |
310 |
2,606 |
1,810 |
1,951 |
1,259 |
776 |
2,037 |
11,706 |
8,547 |
|
in thousands of US$ |
5,005 |
3,467 |
2,193 |
343 |
2,944 |
2,003 |
2,204 |
1,394 |
877 |
2,254 |
13,224 |
9,461 |
|
* Peter van Rossum retired as Management Board member during the extraordinary meeting of shareholders of November 30, 2016 and his contract ended at the Annual General Meeting of April 13, 2017 |
||||||||||||
1. Base Salary
The Supervisory Board decided that Base Salary levels would not change in 2017 compared to 2016. As such no indexation or other increases have taken place. However the Management Board itself decided to temporarily reduce their Base Salary by 10% considering the difficult market circumstances and the reduction of the Company’s workforce in 2016. This decision was for the period of one year (12 month basis) and was implemented per September 2016. As such a (pro rata) decrease in Base Salary figures is visible in the ’Remuneration of the Management Board by (former) member’ table between 2016 and 2017.
On November 30, 2016, Mr. D.H.M. Wood was appointed as Management Board member and was designated Chief Financial Officer. The voluntary 10% reduction on base salary was not applicable to Mr. Wood.
2. Short-Term Incentive
For 2017 the Supervisory Board decided that the Company performance indicators outweighed the Personal performance indicators in terms of importance to the overall performance.
The Supervisory Board also decided that the group balanced scorecard would represent the Company performance indicators. This balanced score card contains key objectives as derived from the long-term strategy and three-year-plan cycle applicable throughout the organization.
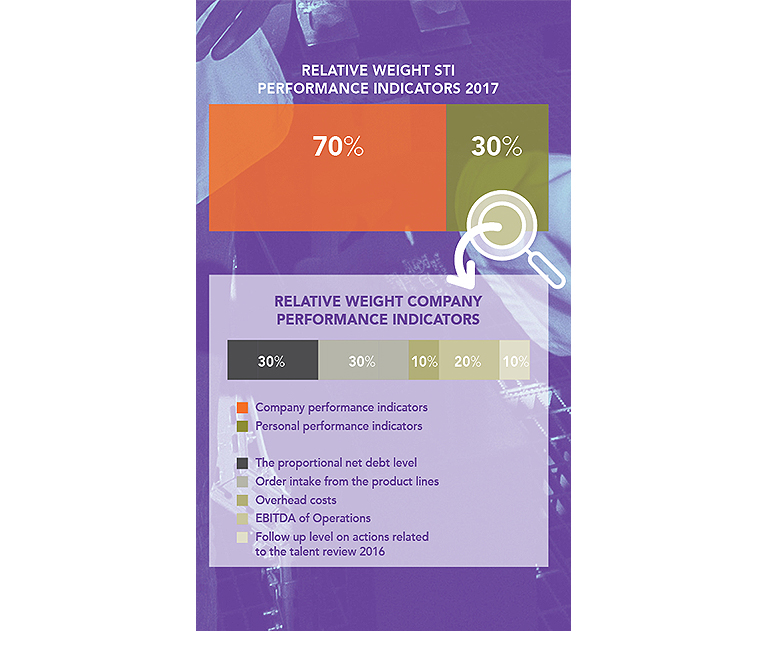
The metrics used in the 2017 balanced scorecard were:
- The proportional Net Debt level (weight: 30%);
- Order intake of the Product Lines (weight: 30%);
- Overhead costs (weight: 10%);
- EBITDA of Operations (weight: 20%);
- Follow up level on actions related to the talent review 2016 (weight: 10%).
A scenario analysis of the potential outcomes in relation to the STI was done by the A&RC and subsequently monitored throughout the year.
The Personal Performance Indicators for the Management Board members were related amongst others to aspects such as succession planning, compliance training and awareness, safety performance of the fleet and further development of project funding solutions.
With regard to the Company Performance Indicators, the Supervisory Board, at recommendation of the A&RC, assessed the delivered results for each performance indicator. They concluded that, as realization levels per target ranged between 82% and maximum, the overall score for the company performance indicators resulted in 160% for the CEO and 128% for the other Management Board Members. In summary, the Supervisory Board regards the performance under the Company indicators robust.
With regard to the Personal Performance Indicators the Supervisory Board, again at recommendation of the A&RC, concluded that the Management Board members dealt with the difficult market circumstances in a capable manner. This is reflected in a realization percentage of 95% for each of the Management Board members on their Personal Performance Indicators.
As for the CSR & Quality multiplier, the Supervisory Board assessed that the delivered performance as a whole is best reflected with a maximum outcome of plus 10% in the Short-Term Incentive value. The total performance resulted in a STI award of 186% of Base Salary for the CEO and 141%-146% for the other Management Board members.
3. Long-Term Incentive
With regard to 2017 three LTI items are of importance, namely: the closing of the performance period and subsequent vesting of LTI 2015-2017 granted in 2015, the grant 2017-2019 and the level of share ownership at the end of the year.
LTI grant 2015-2017
The 2015-2017 LTI grant contained two types of Performance Indicators which are displayed below with their relative weighting:
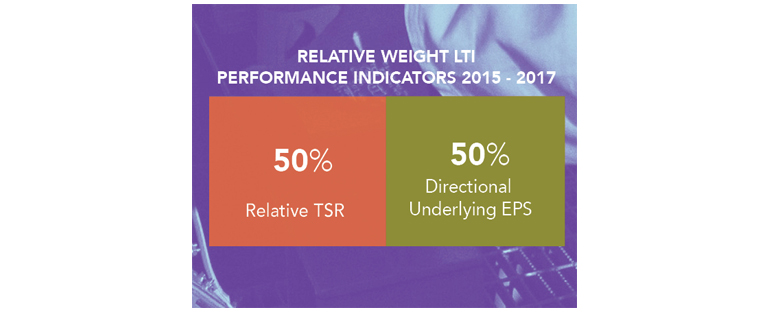
With regard to these Performance Indicators, the Supervisory Board, upon the recommendation of the A&RC, assessed the delivered results and has concluded that:
- The results related to the Relative TSR were realized at maximum as SBM Offshore outperformed the relevant peergroup;
- The results related to the (directional underlying) EPS were realized at target.
LTI grant 2017-2019
The chosen performance indicators and their relative weight will be disclosed in the annual report at the end of the three year performance period.
For the year 2017, the graph ’Maximum LTI Opportunity 2017-2019’ displays the conditional (and maximum) share grants that were awarded to the members of the Management Board for the performance period 2017-2019. The number of shares that will actually vest depend on the actual performance against the set targets but will not exceed the maximum numbers displayed below.
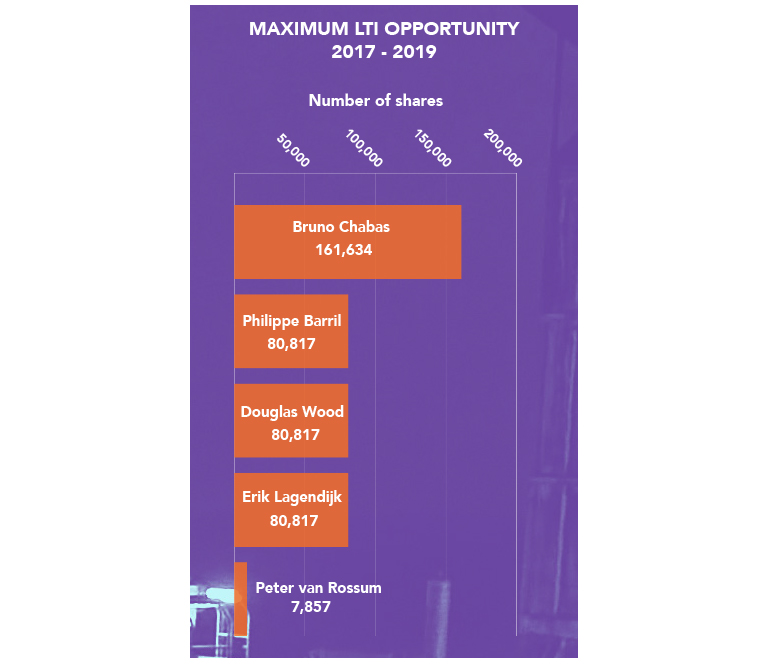
The LTI opportunity of Mr. van Rossum is pro rated due to his retirement prior to completion of the relevant performance period.
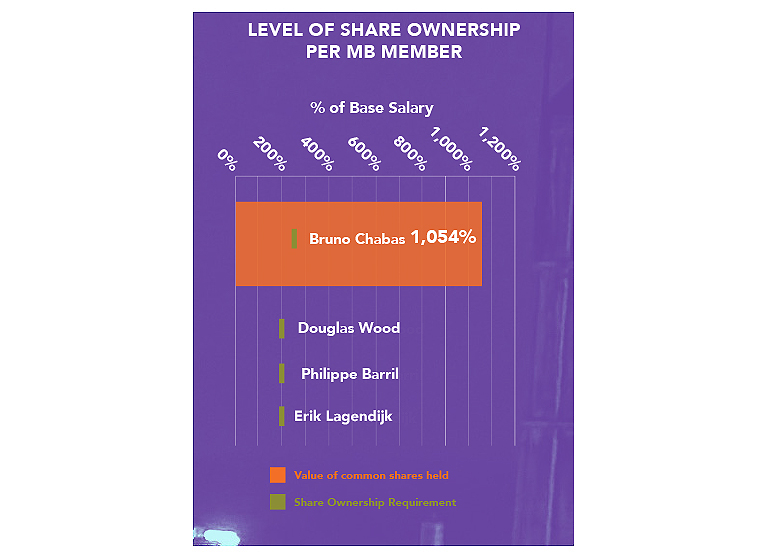
Share ownership requirements
As stated above, each Management Board member must build-up a certain percentage of base salary in share value in SBM Offshore. For the CEO this level is set at an equivalent of 300% of base salary and for the other Management Board members, the level is set at 200%. The graph below displays the actual shareholdings of the Management Board members per the end of 2017 in which only common (unconditional) shares are taken into account. Due to their relative recent appointment Mr. Barril, Mr. Lagendijk and Mr. Wood are still in the process of building up their share ownership requirement.
More details on the share-based incentives (e.g. the number of conditionally granted and/or vested shares in the last few years) are provided in the appendix at the end of this Remuneration Report.
4. Pensions
Management Board members receive a pension allowance equal to 25% of their base salary for pension purposes. Since these payments are not made to a qualifying pension fund, but to the individuals, the Management Board members are individually responsible for investment of the contribution received and SBM Offshore withholds wage tax on these amounts. In addition to the above a supplementary pension arrangement is in place for the CEO. This arrangement is a defined contribution scheme and its costs are included in the table at the beginning of section 3.4.2.
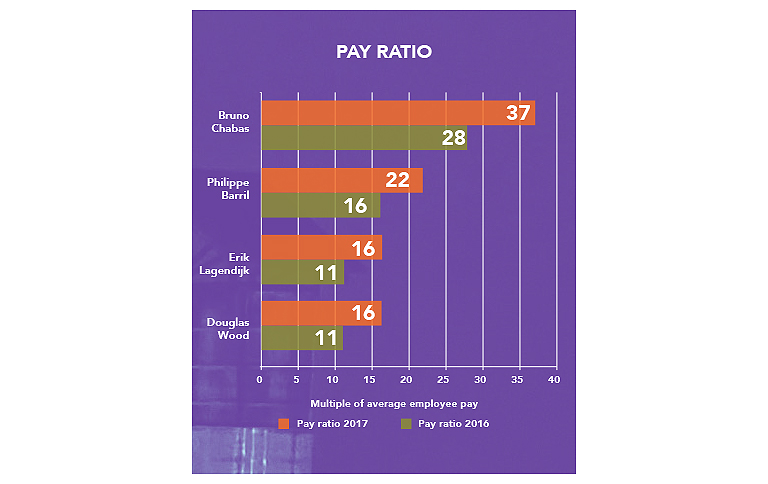
5. Pay ratios
In order to better understand the current internal pay relativities within the organization and to support future decisions on remuneration levels the Supervisory Board reviewed several internal pay-ratios in 2017. The Supervisory Board decided that the chosen pay-ratio should be both relevant and reliable. As a result, the Supervisory Board, based on the recommendation made by the A&RC, determined the pay-ratio as the total remuneration for each of the Management Board members expressed as a multiple of the average overall employee benefit expenses (as derived from the tables in section 4.3.6 from our financial statements). The following graph displays the pay-ratios of each of the (former) Management Board members over 2017 and 2016.
Other elements of 2017 Management Board Remuneration
Allowances
The Management Board members received several allowances in 2017. Most notable is the car allowance which is received by all and the housing allowance for Mr. Chabas and Mr. Barril. The value of these elements is displayed in the table ’Remuneration of the Management Board by (former) member’, at the top of this section.
Retirement of Mr. van Rossum
Mr. van Rossum retired as Management Board member during the extraordinary meeting of shareholders of November 30, 2016 and his contract ended at the Annual General Meeting of April 13, 2017. No severance pay was paid to Mr. van Rossum.